
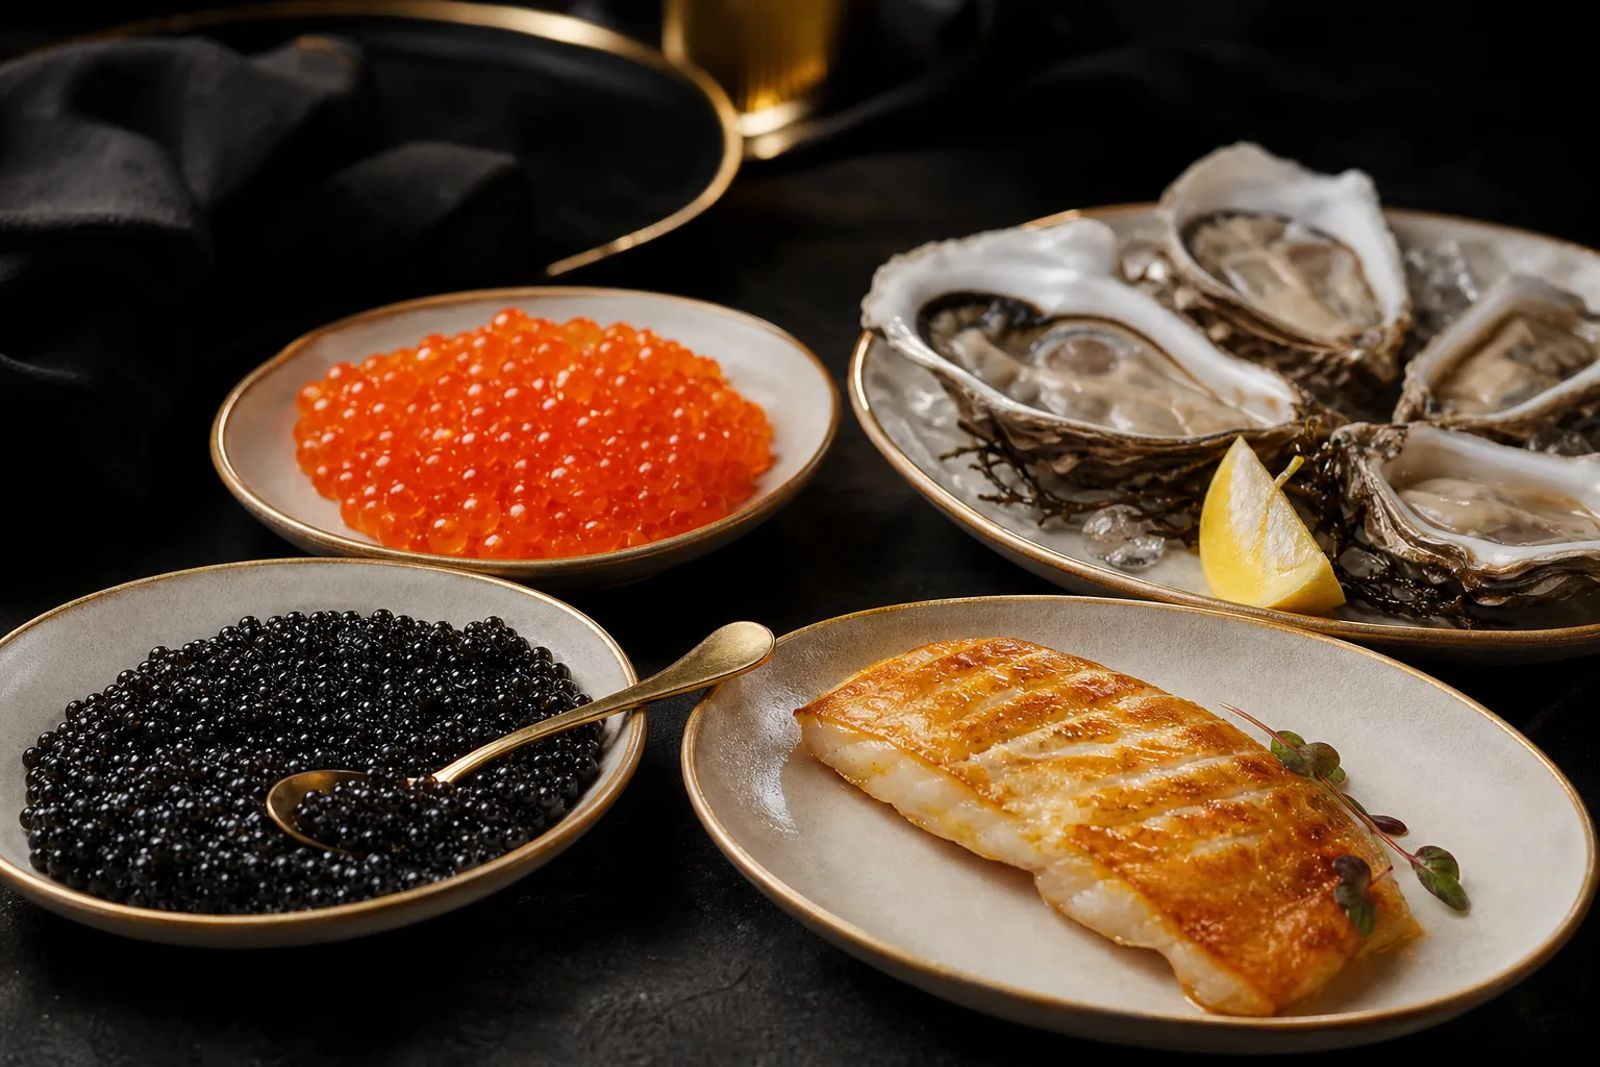
Caviar, salmon roe, oysters and oily fish all contribute protein and micronutrients, but they do not make equivalent portions. A fair nutritional comparison needs both values per 100 g and the amount actually eaten: a small serving of cured roe is not a substitute for a fish fillet.
- The tables below use Japan's national food composition database throughout, rather than combining unrelated national averages.
- Sodium is reported consistently, in milligrams; it is not the same measurement as salt.
- The caviar entry identifies sturgeon roe, avoiding the broader American database entry labelled “black and red” caviar.
Choose the food before comparing the numbers
All numerical food values here come from Japan's Ministry of Education, Culture, Sports, Science and Technology, or MEXT. Its Standard Tables of Food Composition in Japan, eighth revised edition with the 2023 supplement, are available through a database updated in June 2026 to incorporate published corrections.
The four entries are salted caviar, listed as Acipenser spp.; salted chum salmon roe, or ikura; raw cultured Pacific oysters; and farmed Atlantic salmon, skinless and cooked with dry heat. Salmon represents oily fish here, not an average of salmon, sardines, herring and mackerel.
Using one database keeps the reporting framework consistent. It does not turn these entries into a single laboratory experiment, or make their different processing states identical: the roes are cured, the oysters raw and the salmon cooked.
This choice also avoids treating the USDA's generic “Fish, caviar, black and red, granular” entry as a species-specific analysis of sturgeon caviar. MEXT identifies its caviar as sturgeon, but does not identify an individual species, farm or product. For the wider nutritional background, see caviar nutrition.
Energy should be taken from the selected database field, not reconstructed by multiplying the displayed protein and fat by familiar calorie factors. The database presents several analytical measures, and rounded macronutrient figures need not reproduce its published energy value.
Caviar compared with salmon roe, oysters and oily fish per 100 g
These figures describe 100 g of edible food, excluding oyster shells and other discarded parts. Energy is shown in kilojoules and kilocalories; protein and fat use the database's conventional protein and total lipid fields, not its separate amino-acid-based protein or triacylglycerol-equivalent fields.
| Nutrient | Caviar | Salted salmon roe | Raw oysters | Cooked salmon |
|---|---|---|---|---|
| Energy, kJ | 1,014 | 1,057 | 245 | 953 |
| Energy, kcal | 242 | 252 | 58 | 229 |
| Protein, g | 26.2 | 32.6 | 6.9 | 23.9 |
| Fat, g | 17.1 | 15.6 | 2.2 | 15.7 |
| Total omega-3, g | 2.36 | 4.70 | 0.52 | 2.1 |
Sources: MEXT foods 10113, 10140, 10292 and 10442, respectively; their general composition and fatty acid panels. The cooked salmon omega-3 figure is from the MEXT fatty acid panel for food 10442.
| Nutrient | Caviar | Salted salmon roe | Raw oysters | Cooked salmon |
|---|---|---|---|---|
| Cholesterol, mg | 500 | 480 | 38 | 72 |
| Sodium, mg | 1,600 | 910 | 460 | 52 |
| Vitamin B12, µg | 19.0 | 47.0 | 23.0 | 9.4 |
| Vitamin D, µg | 1.0 | 44.0 | 0.1 | 7.7 |
| Zinc, mg | 2.5 | 2.1 | 14.0 | 0.3 |
Source: the same four MEXT food entries and general composition panels. The additional zinc and vitamin D rows are included because both nutrients are reported for every selected food; missing iodine and selenium values for the roes have not been filled from unrelated entries.
Here, total omega-3 means the database's total n-3 polyunsaturated fatty acids. It is not interchangeable with EPA plus DHA, two particular long-chain omega-3 fatty acids, so these totals should not be placed beside an EPA-and-DHA-only figure from another source. Omega-3 in caviar explains that distinction.
What a 15 g serving actually provides
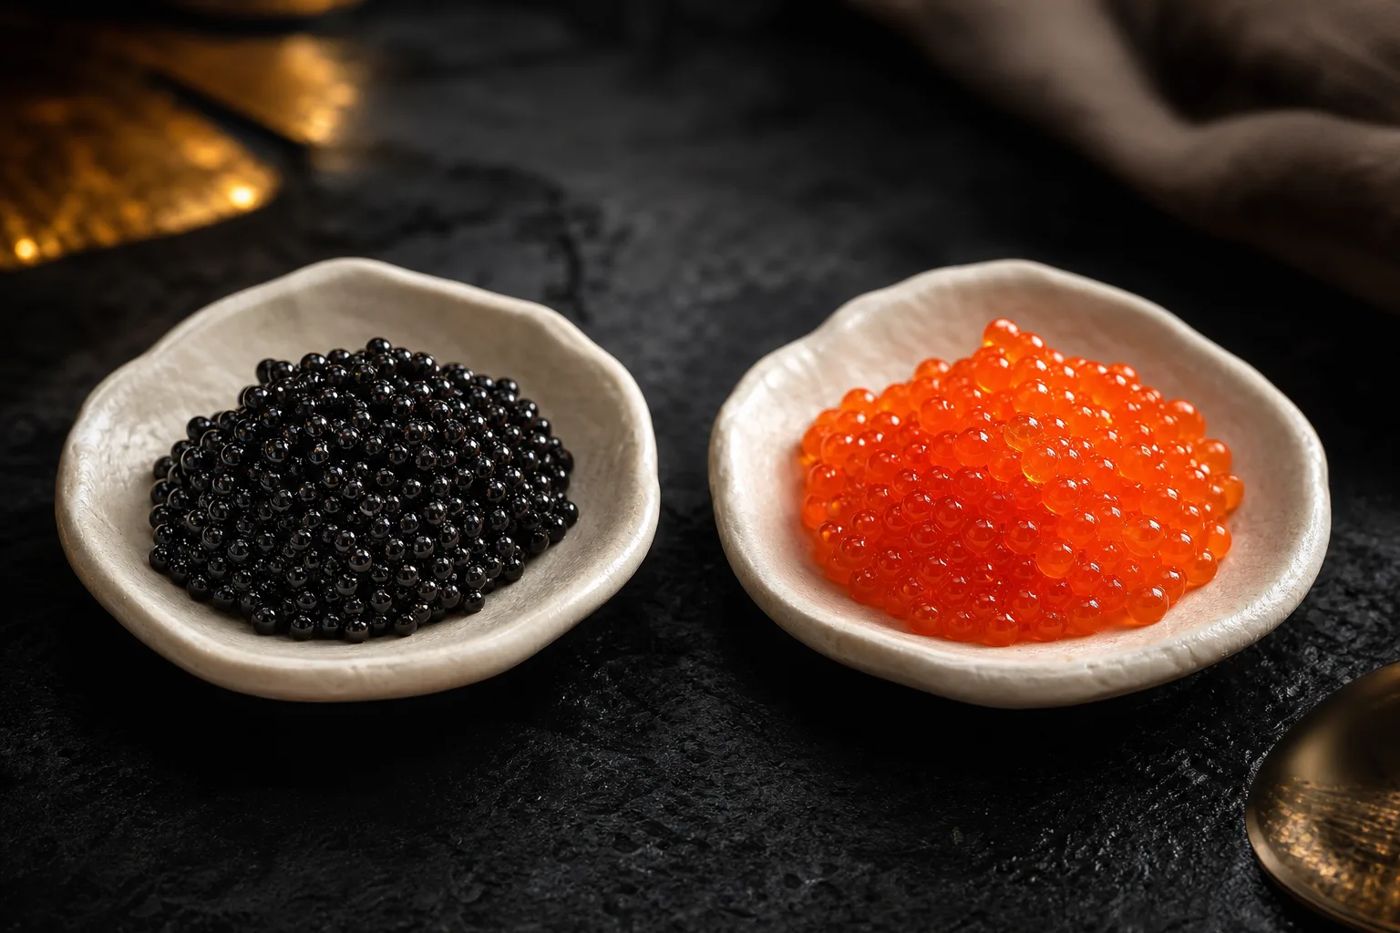
For both roes, the table below uses 15 g, about half an ounce. This is caviar.uk's standard serving for comparison, not a regulatory serving size or a recommendation that everyone should eat that amount.
Then consider the meal as a whole, rather than asking a spoonful of roe to perform the nutritional role of a fish portion.
Each value is the corresponding per-100-g figure multiplied by 0.15, then rounded for readability. The calculation covers the roe alone, so accompaniments and seasonings added at the table are outside these totals.
| Nutrient | Caviar, 15 g | Salted salmon roe, 15 g |
|---|---|---|
| Energy, kJ | 152 | 159 |
| Energy, kcal | 36.3 | 37.8 |
| Protein, g | 3.9 | 4.9 |
| Fat, g | 2.6 | 2.3 |
| Total omega-3, mg | 354 | 705 |
| Cholesterol, mg | 75 | 72 |
| Sodium, mg | 240 | 137 |
| Vitamin B12, µg | 2.85 | 7.05 |
| Vitamin D, µg | 0.15 | 6.6 |
| Zinc, mg | 0.38 | 0.32 |
Sources: MEXT salted caviar, food 10113, and salted chum salmon roe, food 10140; calculations by caviar.uk. The small serving supplies roughly 4 to 5 g of protein, rather than the much larger quantity suggested by reading the per-100-g column as a portion.
Why a fish portion changes the comparison
UK NHS guidance describes a fish portion as around 140 g and specifies cooked weight for oily fish. It recommends at least two portions of fish a week, including one of oily fish; that advice concerns a dietary pattern, not a nutrient competition between individual foods.
Applying that 140 g cooked portion to the salmon entry gives about 321 kcal and 33.5 g of protein. The fish portion weighs more than nine times as much as the 15 g roe serving, so comparing their nutrient concentrations alone misses most of what reaches the plate.
Oysters need the same care with weights. The comparison uses their edible flesh, not a count of shells: without the weight of the flesh, “six oysters” cannot be converted reliably into the nutrients in this table. Nor should a raw fish entry be scaled as though it described cooked weight.
Salt is the main processing difference
Added salt is the central nutritional distinction between cured roes and unsalted fish in this comparison. The database records 1,600 mg sodium per 100 g of caviar and 910 mg for salted salmon roe, against 52 mg for the cooked salmon.
Raw oysters are not sodium-free: this entry contains 460 mg per 100 g without being a cured roe. The useful distinction is therefore preparation plus composition, not a blanket assumption that every fresh seafood has the same sodium content.
Sodium and salt are different measures. To express sodium as an approximate salt equivalent, multiply its weight by 2.5; keep the units consistent. For a particular tin, use the product's declared nutrition information rather than substituting this database average, especially when tracking salt in caviar.
Read the strengths without declaring a winner
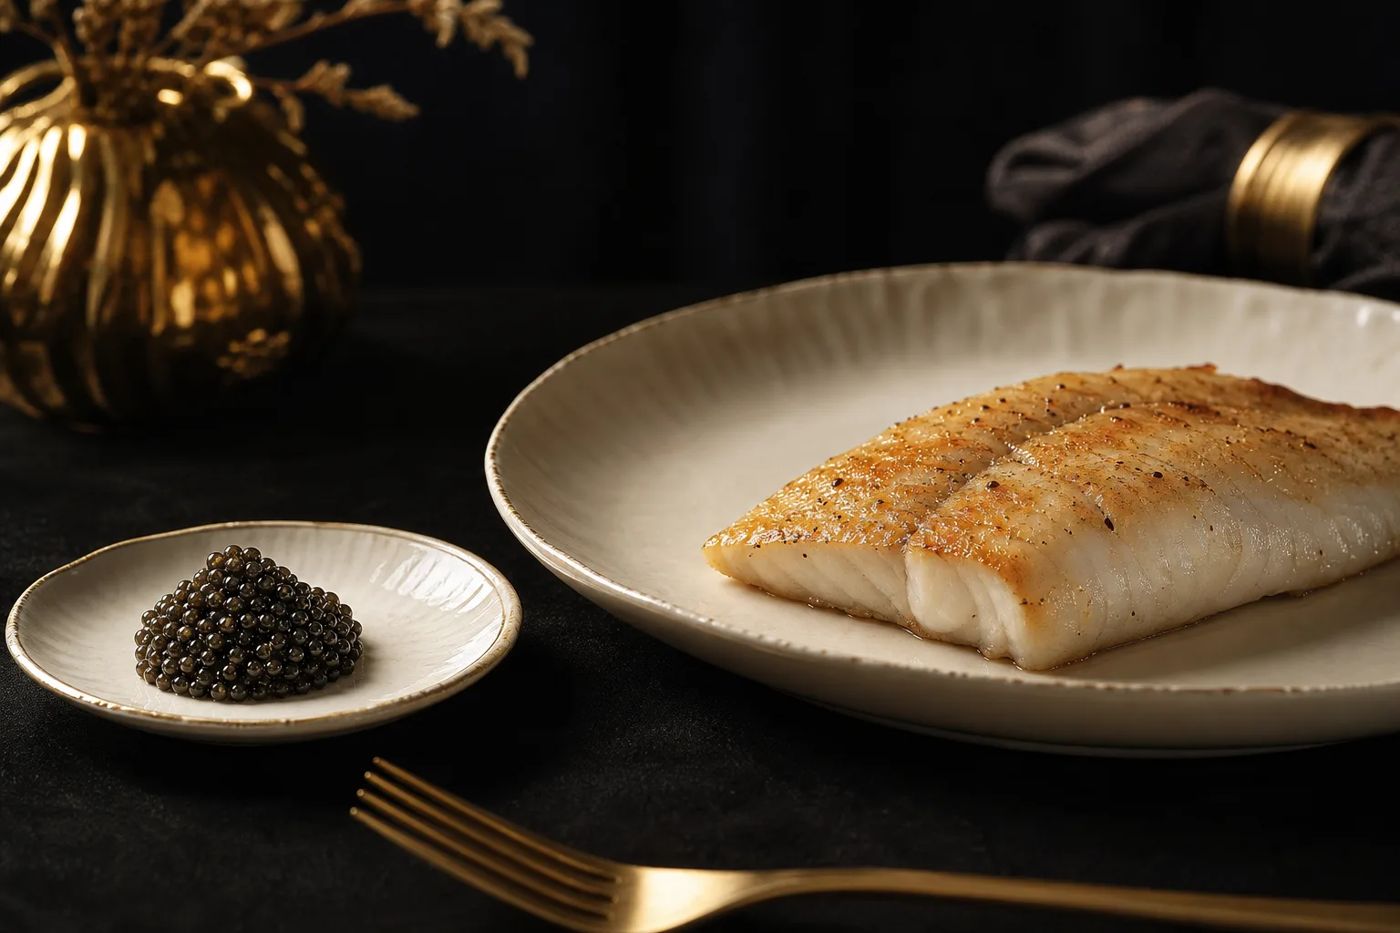
In these entries, salted salmon roe has the highest protein and vitamin B12 concentrations, while oysters have the most zinc. Those are descriptions of selected database foods, not evidence that one is healthier overall, and they do not account for the rest of a meal.
Both roes also have higher cholesterol concentrations than the oyster and salmon entries. Cholesterol is reported separately from total fat because they are different measurements; a row of composition figures cannot establish an individual's cardiovascular risk or replace personalised advice.
The striking vitamin D difference between these caviar and salmon roe entries is another reason not to transfer a nutrient claim from one kind of roe to another. For flavour, texture and culinary use rather than nutrients, read salmon roe versus sturgeon caviar.
What to do when the data do not match
If another database is needed, identify the country, exact food and preparation beside its values. Do not quietly insert raw mixed fish roe for salted salmon roe, or total omega-3 for EPA plus DHA. An unavailable result should remain unavailable, rather than become a zero or an estimate borrowed from a different food.
Mercury and other contaminants need a separate assessment, not an inference from these nutrient totals: see mercury and contaminants in caviar. Sustainability is also outside this nutritional comparison; the NHS fish and shellfish guidance addresses environmental sourcing separately.
For an actual meal, start with the amount you intend to eat, choose the closest preparation in the database and check the product label where available. Then consider the meal as a whole, rather than asking a spoonful of roe to perform the nutritional role of a fish portion.
Sources
- MEXT, Japan. Standard Tables of Food Composition in Japan, eighth revised edition, 2023 supplement; database update dated 9 June 2026. Publication and corrections register, database update notice and description of the database's standard values. These establish the edition, correction history and edible-portion basis.
- MEXT, Japan. Standard Tables of Food Composition in Japan, eighth revised edition, 2023 supplement, food 10113, “Caviar, salted product”. General composition and fatty acids per 100 g edible portion. These provide the caviar values and the identification Acipenser spp.
- MEXT, Japan. Standard Tables of Food Composition in Japan, eighth revised edition, 2023 supplement, food 10140, “Chum salmon, ikura, salted roe”. General composition and fatty acids per 100 g edible portion. These provide the salted salmon roe values.
- MEXT, Japan. Standard Tables of Food Composition in Japan, eighth revised edition, 2023 supplement, food 10292, “Pacific oyster, cultured, raw”. General composition and fatty acids per 100 g edible portion. These provide the oyster values and distinguish edible flesh from shell waste.
- MEXT, Japan. Standard Tables of Food Composition in Japan, eighth revised edition, 2023 supplement, food 10442, farmed Atlantic salmon, skinless, cooked with dry heat. General composition and fatty acid panel. The MEXT fatty acid panel gives 2.10 g total n-3 per 100 g.
- USDA Agricultural Research Service, United States. National Nutrient Database for Standard Reference, Release 27, 2014, food group 15, NDB 15012, “Fish, caviar, black and red, granular”. Official nutrient report. Used only to verify the broad entry description, not for the comparison's nutrient values.
- NHS, United Kingdom. Fish and shellfish, live web guidance, checked November 2026. Official guidance. This supplies the approximately 140 g cooked oily-fish portion, weekly fish guidance and separate environmental sourcing discussion.
- Healthdirect Australia. Salt and sodium: how to reduce intake, live web guidance, checked November 2026. Official guidance. This explains sodium-to-salt conversion and the complementary uses of per-serving and per-100-g figures.
This piece was researched from official national food composition records and public health guidance, with serving values calculated from the stated database entries rather than product marketing.
Last checked: November 2026