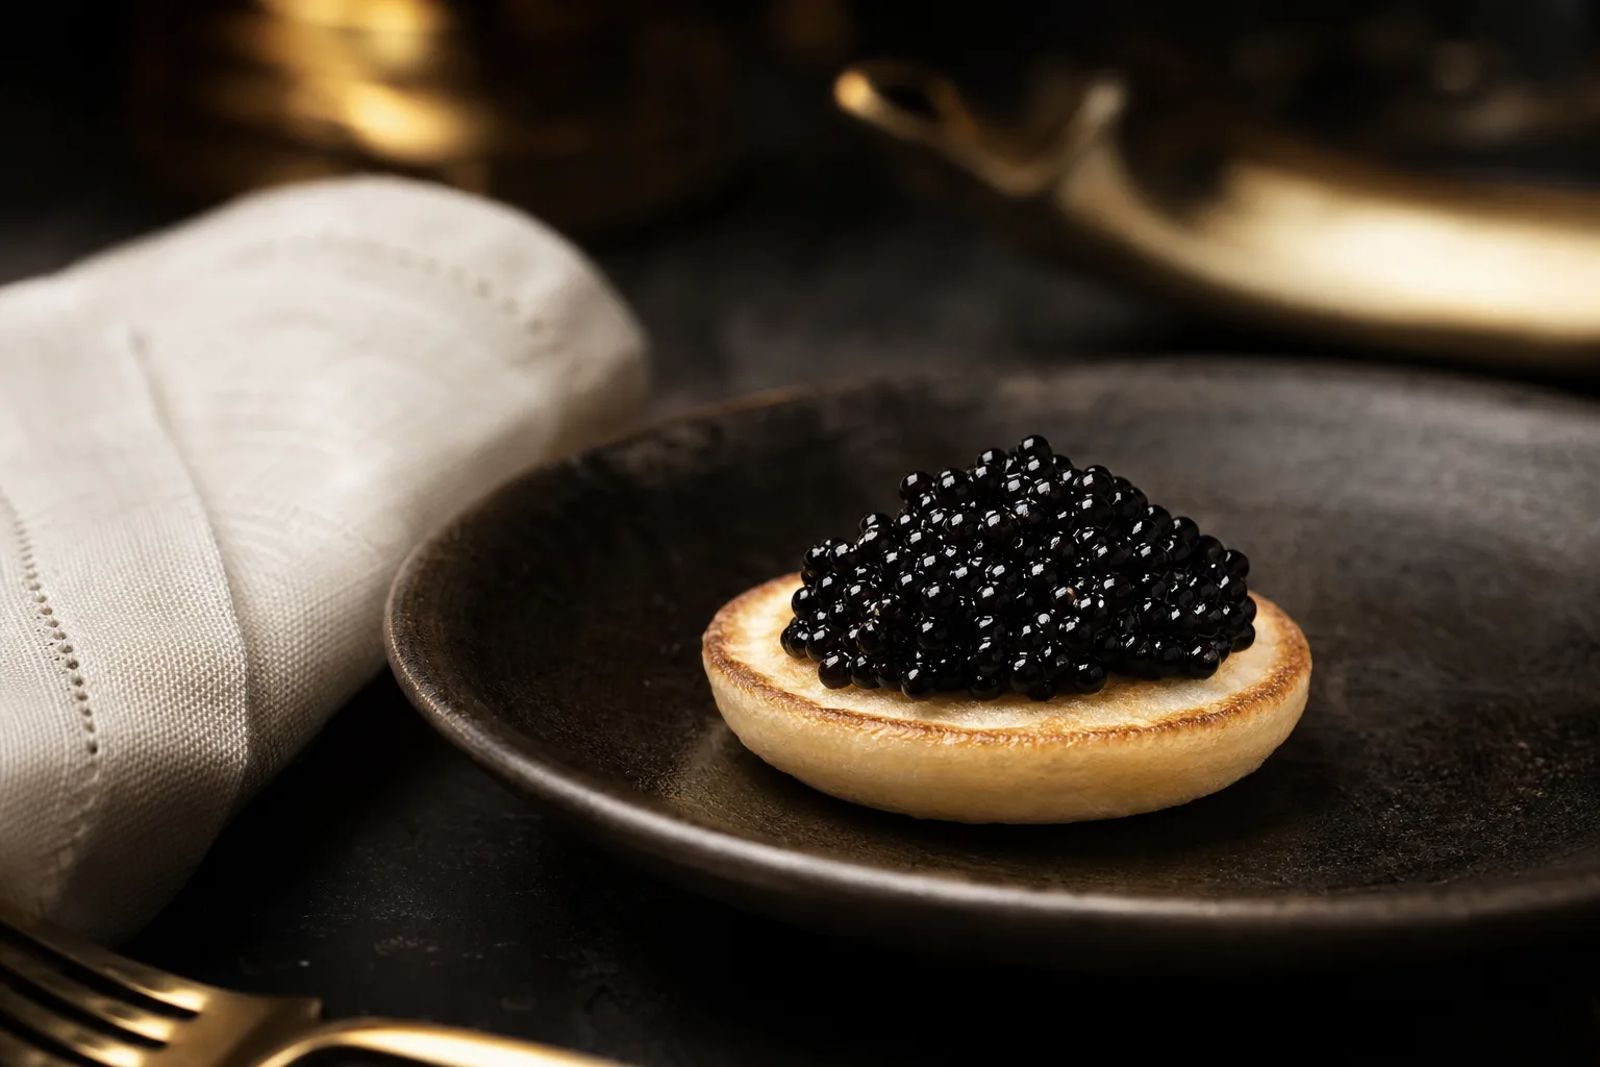
About half an ounce of caviar: 3.7 g of protein, 2.7 g of fat and roughly 40 kcal. Those reference figures for a 15 g portion come from a generic US database entry covering black and red caviar, rather than sturgeon alone. Studies of sturgeon caviar confirm the central picture: protein and fat, including the omega-3 fatty acids EPA and DHA, are key parts of its composition.
Read the figures at the scale of a serving, and a small topping comes into sharper nutritional focus.
- Start with the nutrition panel for your particular product when available.
- Compare products per 100 g, then calculate the portion you actually eat.
- Nutrient content alone does not establish a health benefit.
Caviar nutrition per 100 g and per 15 g
The table below gives a reference point for energy, protein, fat, vitamins and minerals.
Source: United States, USDA Standard Reference, Release 28 (2015), entry 15012, “Fish, caviar, black and red, granular”. These are generic values, not sturgeon-specific measurements. USDA records no analytical observations for several entries, including EPA and DHA.
The 15 g portion, about half an ounce, is this site's standard serving for comparison. It is neither a regulatory serving size nor a dietary recommendation. Each portion value is the 100 g figure multiplied by 0.15 and rounded; salt is calculated separately from sodium.
| Nutrient | Per 100 g | Per 15 g |
|---|---|---|
| Energy (kJ/kcal) | 1105/264 | 166/40 |
| Protein (g) | 24.60 | 3.69 |
| Fat (g) | 17.90 | 2.69 |
| Saturated fat (g) | 4.06 | 0.61 |
| Carbohydrate (g) | 4.00 | 0.60 |
| Cholesterol (mg) | 588 | 88.2 |
| Sodium (mg) | 1500 | 225 |
| Salt equivalent (g) | 3.75 | 0.56 |
| EPA (mg) | 2741 | 411 |
| DHA (mg) | 3800 | 570 |
| Vitamin B12 (µg) | 20.00 | 3.00 |
| Vitamin A (µg RAE) | 271 | 40.7 |
| Vitamin D (µg) | 2.9 | 0.44 |
| Vitamin E (mg) | 1.89 | 0.28 |
| Folate (µg) | 50 | 7.5 |
| Choline (mg) | 490.9 | 73.6 |
| Calcium (mg) | 275 | 41.3 |
| Iron (mg) | 11.88 | 1.78 |
| Magnesium (mg) | 300 | 45 |
| Phosphorus (mg) | 356 | 53.4 |
| Potassium (mg) | 181 | 27.2 |
| Zinc (mg) | 0.95 | 0.14 |
| Selenium (µg) | 65.5 | 9.83 |
RAE means retinol activity equivalents, the unit used for vitamin A. EPA and DHA are individual omega-3 fatty acids already included in total fat. Do not add them to it.
What the figures reveal, and where they stop
Sturgeon-specific research brings the picture into sharper focus. Gong and colleagues analysed nine tins from farmed Siberian sturgeon, Amur sturgeon and a cross with a female kaluga parent and a male Amur sturgeon parent in China. They used standard composition tests and gas chromatography for fatty acids.
Protein ranged from 23.98 to 25.55 g per 100 g; fat ranged from 14.23 to 16.22 g. These measurements support the broad protein and fat picture. They do not validate every vitamin or mineral value in the table, whose black and red caviar category can conceal differences between species.
The basis of a measurement matters as much as the number. DHA expressed as a percentage of total fatty acids is not grams of DHA per 100 g of caviar. Converting it requires the amount of fat and the analytical basis. Likewise, dry-weight results exclude water; the table above describes edible food as eaten.
The nutrition hub separates these reference numbers from the evidence on individual nutrients. To compare caviar with other seafood, use matched food comparisons. Fish eggs do not all have the same composition.
Why one caviar differs from another
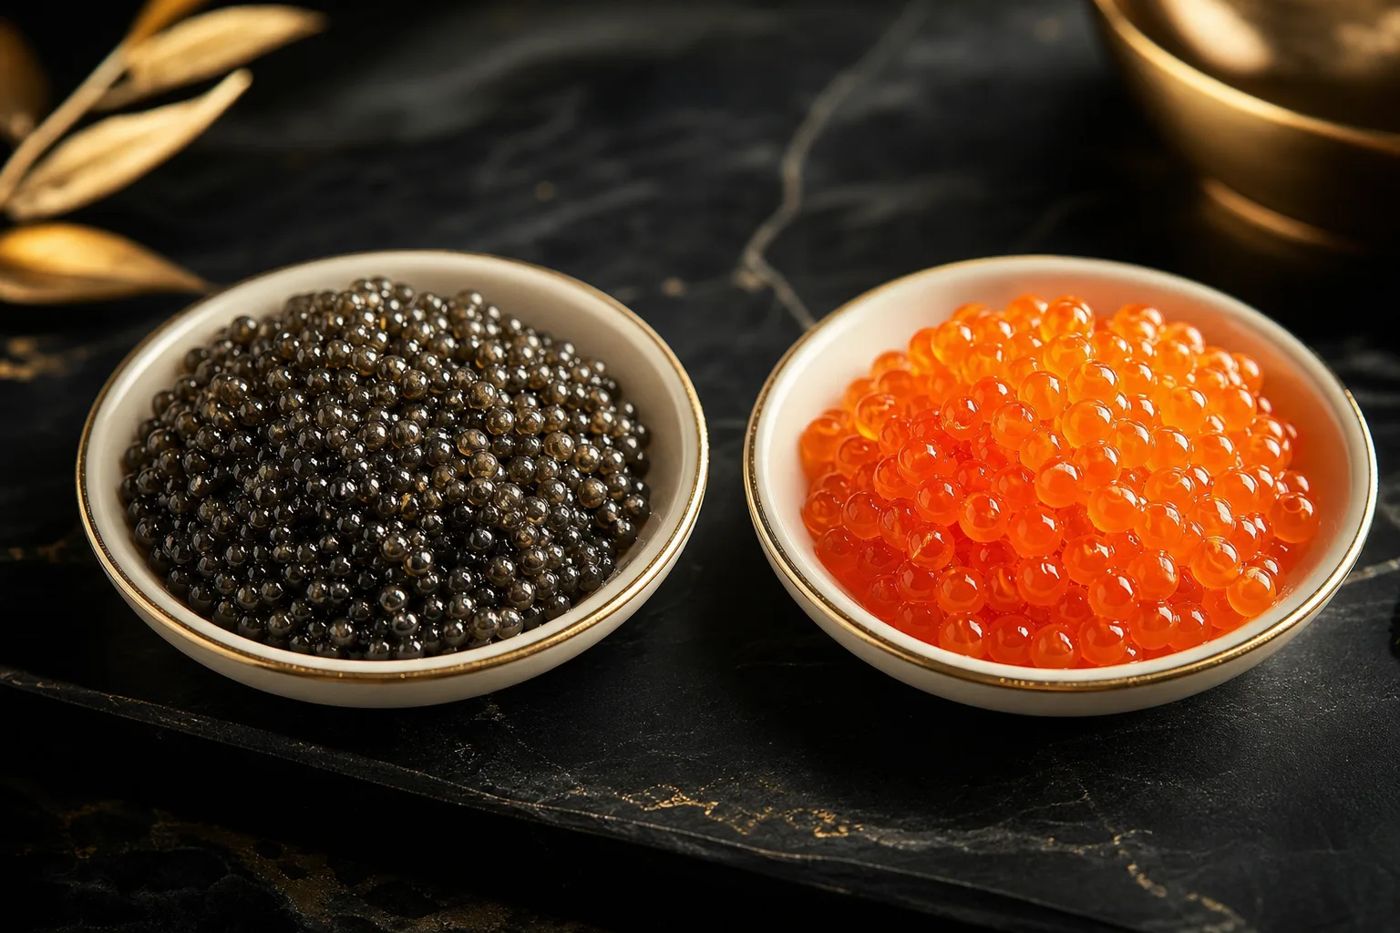
A species name is a starting point, not a complete nutrition specification. Individual fish matter too. In a 2020 Italian study, researchers compared raw eggs and matured caviar from Siberian, Russian and white sturgeon using standard composition analysis and gas chromatography. Several compositional and fatty acid measures differed between species.
Feed can change the fatty acid pattern, particularly when vegetable oils replace some of the fish oil in farm diets. The Italian researchers discussed evidence that eggs can selectively retain EPA and DHA, however, so a change in feed need not alter every fatty acid in the same proportion.
“Wild” and “farmed” are not nutritional grades. In 2002, Wirth and colleagues examined fatty acids in caviar from 34 wild-caught and 12 farmed fish, including paddlefish as well as sturgeons. They found differences related to origin. That mixed, historical sample cannot provide a universal ranking of today's farmed sturgeon caviar.
Salting and maturation change the finished food too. The Italian study found changes consistent with moisture loss and increased mineral residue during these processes. Less water can mean more protein or fat per 100 g without the fish having produced any more of either.
What the main nutrients mean
Portion size turns composition into intake. Protein, fat and a smaller carbohydrate contribution account for the energy in caviar composition tables. The guide to protein, calories and carbohydrates explains how to read those figures in the context of what you eat, without treating a small topping as a full protein portion.
Fat is a mixture of saturated, monounsaturated and polyunsaturated fatty acids, not one nutritionally uniform substance. EPA, eicosapentaenoic acid, and DHA, docosahexaenoic acid, are long-chain omega-3s measured in sturgeon studies. The guide to omega-3 in caviar explains the amounts and the distinction between percentages of extracted fatty acids and grams per serving.
Cholesterol is listed separately from total fat. It is not the same as saturated fat, and its presence alone does not establish what eating caviar will do to a person's blood cholesterol. That question belongs to the wider assessment in the health evidence.
Vitamins and minerals deserve the same attention to portion size and source quality as protein and fat. The reference values above include B12, vitamin D, iron and selenium. The guide to vitamins and minerals in caviar explores their significance and how far generic records can describe an individual product.
Salt and sodium: read the units
Sodium is a mineral. Salt on an EU nutrition declaration is a calculated equivalent. Regulation (EU) No 1169/2011 defines the calculation as salt = sodium × 2.5. This includes naturally present sodium as well as sodium from added ingredients.
Before comparing labels, put the figures in the same units. Milligrams of sodium are not grams of salt: multiply sodium in milligrams by 2.5, then divide by 1,000 to obtain grams of salt. The guide to salt in caviar explains how much salting terminology can tell you about the amount in the tin.
Reading labels and nutrition claims
A nutrient measurement and a health claim answer different questions. Finding a nutrient in caviar does not, by itself, demonstrate a health benefit from eating it. Nor does a laboratory result automatically allow a producer to advertise a product as “high in” that nutrient. Commercial wording must meet the conditions of the relevant jurisdiction.
Less water can mean more protein or fat per 100 g without the fish having produced any more of either.
For EU labels, Regulation (EU) No 1169/2011 generally requires prepacked foods to carry nutrition information per 100 g, subject to exemptions: energy, fat, saturates, carbohydrate, sugars, protein and salt. Claims fall separately under Regulation (EC) No 1924/2006, which governs nutrition and health claims, including permitted wording and conditions of use.
Those frameworks also underpin the rules in Great Britain, which uses their assimilated, amended versions, with the GB nutrition and health claims register relevant to authorised health claims. EU nutrition legislation generally continues to apply in Northern Ireland. Check a claim against the rules for the market where the food is sold.
US labels take a different approach: FDA Nutrition Facts information usually appears per labelled serving, with sodium declared rather than salt. FDA distinguishes nutrient content claims from health claims and permits factual amount statements under its rules. The serving size reflects customary consumption, not a recommendation of how much to eat.
These labelling and claims frameworks were checked in November 2026. The reference table here provides editorial nutrition information, not a substitute for a legally compliant product declaration.
Who should take particular care
A fish or fish-roe allergy calls for individual advice, not a decision based on a nutrition table. Published case evidence documents anaphylaxis to beluga caviar. A case report establishes that a reaction occurred, but cannot show how often reactions occur.
Chilled, ready to eat caviar can pose a Listeria risk, particularly during pregnancy or for people with reduced immunity. UK NHS listeriosis advice covers cold smoked or cured fish rather than caviar specifically, and says to cook it until steaming hot. Consult current guidance where you live, as advice differs by country, and discuss caviar with a doctor or midwife. See the health evidence for the wider assessment.
If you have been advised to restrict sodium, use the product's own declaration and your planned portion. Take personal dietary restrictions to your clinician or dietitian rather than relying on a generic database average.
Putting the numbers to use
Start with the actual weight of caviar, not the number of spoonfuls. To adapt a product's per 100 g declaration, multiply each figure by your portion in grams, then divide by 100. Double the portion and every listed nutrient amount doubles.
Assess accompaniments separately. Bread, blinis, cream and butter bring their own nutrients to the plate; a caviar-only table cannot describe the whole dish. Calculate each ingredient on the same portion basis before adding the totals.
Sources
-
United States Department of Agriculture, Agricultural Research Service. USDA National Nutrient Database for Standard Reference, Release 28: Finfish and Shellfish Products, 2015. Entry 15012, “Fish, caviar, black and red, granular”, PDF pages 133 to 135. Official nutrient report.
-
Gong, Y., and colleagues. Nutritional Composition of Caviar from Three Commercially Farmed Sturgeon Species in China. Journal of Food and Nutrition Research, volume 1, issue 5, 2013, pages 108 to 112. Original research article.
-
University of Milan repository, López, A., and colleagues. Sturgeon Meat and Caviar Quality from Different Cultured Species. Fishes, volume 5, article 9, 2020. Full research paper.
-
Wirth, M., and colleagues. Fatty Acid Composition in Sturgeon Caviar from Different Species: Comparing Wild and Farmed Origins. International Review of Hydrobiology, volume 87, 2002, pages 629 to 636. Abstract only: https://doi.org/10.1002/1522-2632(200211)87:5/6<629::AID-IROH629>3.0.CO;2-C
-
European Parliament and Council, EUR-Lex. Regulation (EU) No 1169/2011 on the provision of food information to consumers, 2011, particularly Articles 30 to 33 and Annex I, point 11. Indexed official text cross-checked against government nutrition-labelling guidance. Official regulation.
-
Food Standards Agency. Nutrition Labelling Information for Food Businesses, guidance for the requirements applying from December 2016. Official guidance leaflet.
-
European Commission. Nutrition and Health Claims, live guidance on Regulation (EC) No 1924/2006, checked November 2026. Commission guidance.
-
Department of Health and Social Care. Nutrition legislation information sheet, live edition, checked November 2026, particularly sections 1 and 4. Official information sheet.
-
GOV.UK. Packaging and labelling, live guidance, checked November 2026. Official indexed text identifies the assimilated version of Regulation 1169/2011 as applicable in Great Britain. Official guidance.
-
United States Food and Drug Administration. How to Understand and Use the Nutrition Facts Label, live edition, checked November 2026. FDA consumer guidance.
-
United States Food and Drug Administration. Label Claims for Conventional Foods and Dietary Supplements, live edition, checked November 2026. FDA claims guidance.
-
NHS. Listeriosis, live edition, checked November 2026, particularly “Foods to avoid if you're at risk”. NHS guidance.
-
PubMed, US National Library of Medicine. Anaphylaxis to Beluga caviar, Asian Pac J Allergy Immunol, 2020, PMID 30660175. Indexed case report.
This piece was researched from an official USDA nutrient report, primary composition studies and official labelling, claims and health guidance, with serving values calculated from the stated source.
Last checked: November 2026